Marketers always search for the best digital marketing strategies to promote a product or service. Should we focus on Google Ads? Facebook Ads? Email marketing? Organic search? â
With so many different strategy options, the problem is figuring out which ones are paying off and which ones we should avoid investing more time and money into. The Growth Share Matrix can help with that.
What Is the Growth Share Matrix?
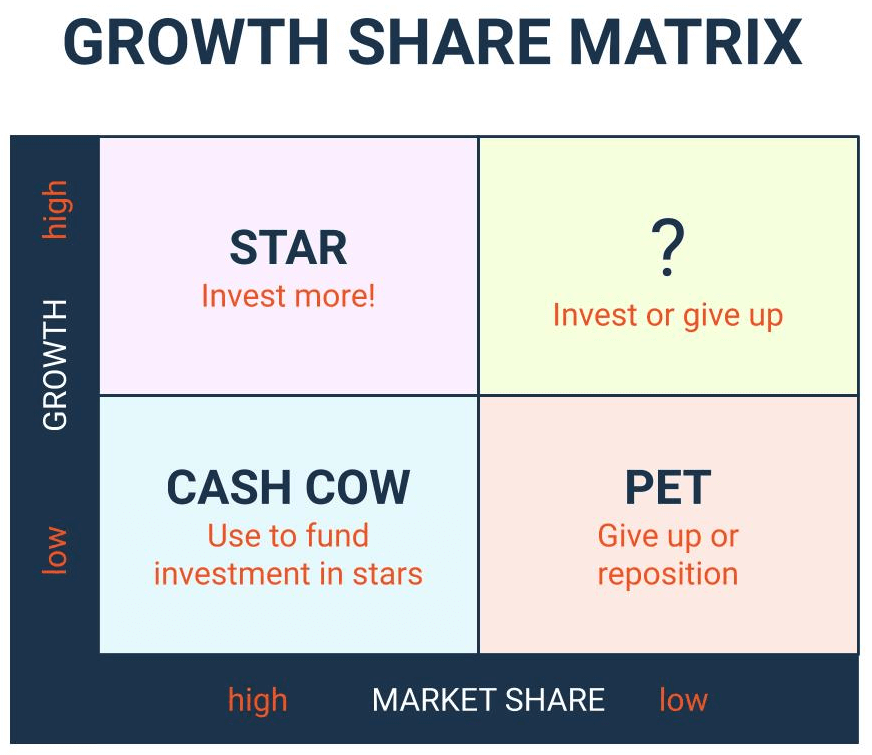
The Growth Share Matrix is a competitive analysis framework that divides your company’s products into four classifications based on their success. The framework was created by Bruce D. Henderson, founder of the Boston Consulting Group (BCG), which is also why it is sometimes called the BCG Matrix. Initially, It was designed to help companies decide what products to invest in or cut based on market attractiveness and competition, but the Growth Share Matrix has evolved.
When the framework was first introduced in 1970, the business landscape differed significantly from today’s. BCG revisited the Growth Share Matrix concept in a 2014 article, highlighting how it had changed since then. The article pointed out how today’s business landscape’s often unpredictable and rapid pace, brought on by technological advancements, has shaped the Growth Share Matrix for the modern era.
One of the key takeaways from the 2014 article was also a question about whether the Growth Share Matrix had lost its value in the modern era, to which the writers — Martin Reeves, Sandy Moose, and Thijs Venema — respond: “No, on the contrary. However, its significance has changed: it needs to be applied with greater speed and focus on strategic experimentation to allow adaptation to an increasingly unpredictable business environment.”
The 4 Classification Types of a Growth Share Matrix
The Growth Share Matrix follows a pretty simple premise. Essentially, you divide each of your company’s products into one of four matrix quadrants, or classifications, which follow:
Cash Cows
Low-growth but high-share products. These products bring in cash and can fund investment in your Stars. An example of this might be Coca-Cola because it can’t grow — the flavor doesn’t change. That said, the Coca-Cola Company can always count on this product as a consistent top seller in their market and fund other soft drinks with its profits.
Stars
Your company should invest heavily in products that are likely to achieve high growth and high market share. One example is the iPhone. Apple knows it will sell a boatload of its smartphones every time it hits the market, and it keeps evolving with every iteration.
Question Marks (?)
High-growth but low-market-share products, often new products with high potential. These should be invested in or let go, depending on how likely a product will become a star. Think about a product like Tesla’s Cybertruck, which has a lot of potential in the electric car market but has received mixed reviews in design. The jury is still unsure whether this car will become a top seller.
Pets
Low-share, low-growth products are considered failures. Your business should reposition these products or stop investing in them. One example that comes to mind is Twitter’s foray into the mobile phone space in 2009 with TwitterPeek. The device itself cost $200 and could only send and receive tweets. Safe to say, Twitter didn’t invest in this product for very long.

How Do You Create a Growth Share Matrix for Digital Marketing?
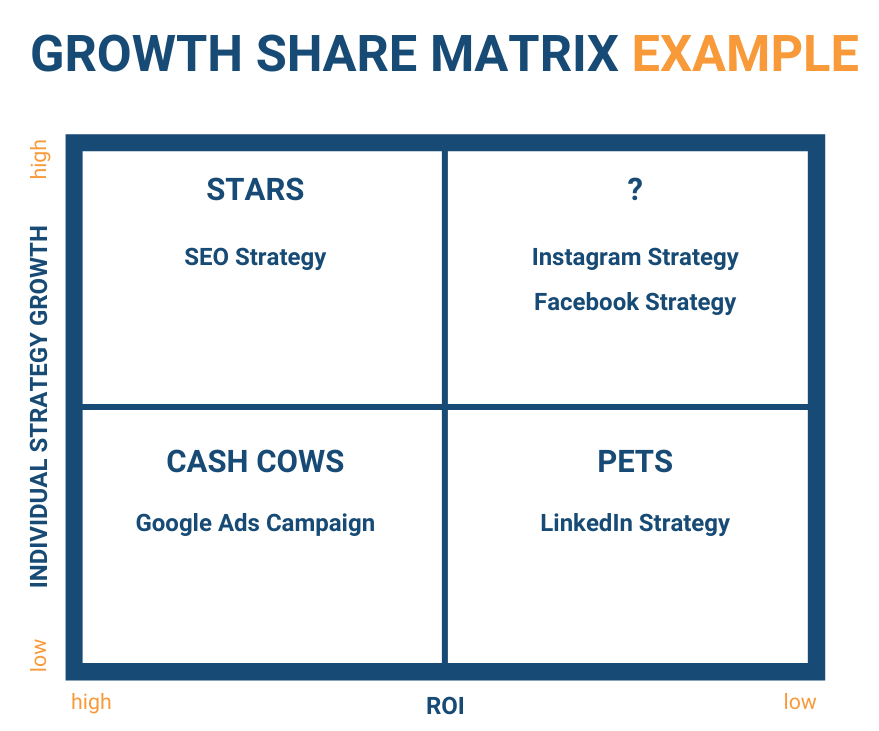
Usually, you’d put growth and market share on the axes of a Growth Share Matrix to help you decide which products your company should invest in or cut. But, in digital marketing, put individual strategy growth and ROI on the axes of your matrix to help you assess success across your different channels and strategies.
We’ve created a Growth Share Matrix that shows hypothetical ad campaigns by location. Our hypothetical Google Ads campaign has low growth but a high ROI, which makes it our cash cow. Our SEO strategy yields high growth and ROI to position it as a star.
Our cash cow, a Google Ads campaign, also gives us room to experiment. We have more flexibility to invest in our Facebook or Instagram strategies, and we can try these question marks out without absorbing massive financial risk. Meanwhile, our LinkedIn strategy is costly and does not grow, so we’d cut it.

It’s also essential to revisit your Growth Share Matrix regularly because the success of your marketing strategies can change quickly. Those question marks can quickly become stars, cash cows, or pets. If you suddenly see your Instagram strategy bringing you a high ROI and growing, you can make it a star. If a Facebook strategy you invested money in isn’t performing as you had hoped and has minimal growth and a low ROI, you can safely categorize it as a pet and move on.
Analyze Your Digital Marketing Strategies with Growth Share Matrix
Digital marketers sometimes forget to analyze strategy performances holistically. They look at the success of an individual campaign but don’t always judge it against similar campaigns. A Growth Share Matrix puts your efforts in context by pitting your strategies against each other.
Equipped with the information from your Growth Share Matrix model, you can make better-informed decisions about your company’s digital marketing strategies, both those that generate the most profit and growth and those that create the least.
Let’s say you look at metrics for that hypothetical paid marketing campaign you ran, and it appears to have an ROI of 300% while maintaining a low CPC. Not bad, right? But if you compare this to an organic campaign for the same budget that drove an ROI of 600% and an even lower CPC, you would understand that your paid marketing campaign may not be the star you initially thought it was.
If you’re looking for specific ways to determine the ROI of a marketing strategy, you can use KPIs like customer lifetime value (CLV) and conversion rate. These key performance indicators (KPIs) can give you better insight into how much value individual customers have from a buyer perspective. CLV, for example, can tell you how much money to expect from a customer over the time they remain a customer.
If you’re looking for specific ways to determine the ROI of a marketing strategy, you can use KPIs like customer lifetime value (CLV) and conversion rate.Click to tweetThese KPIs can help you understand your most valuable channels for driving growth. Analyzing this quantitative data can also help you understand customer patterns, especially since they change over time.
Keep in mind, however, that with changing algorithms on Facebook, Google, LinkedIn, etc., this Growth Share Matrix should be evaluated at the very least every quarter so you are most accurately planning your growth strategy.
Get More Competitive Insights
The Growth Share Matrix allows you to take a step back and determine how your digital marketing strategies are working compared to one another at a high level. That said, you need to get more detailed with your competitive insights to get a fuller picture.
Source: Alexa blog


