
No matter how great we think we are, deep down, we all want to know how people perceive us.
The answer, at least for companies, can be achieved through perceptual mapping. It objectively examines the competitive landscape through verified customer input or marketing data.
As marketers, perceptual mapping can help us make more informed decisions about a company’s market position over competitors and strengthen marketing strategies.
What Is Perceptual Mapping?
Perceptual mapping is a visual representation of a brand, product, or service’s position among competitors. It is also known as positional mapping.
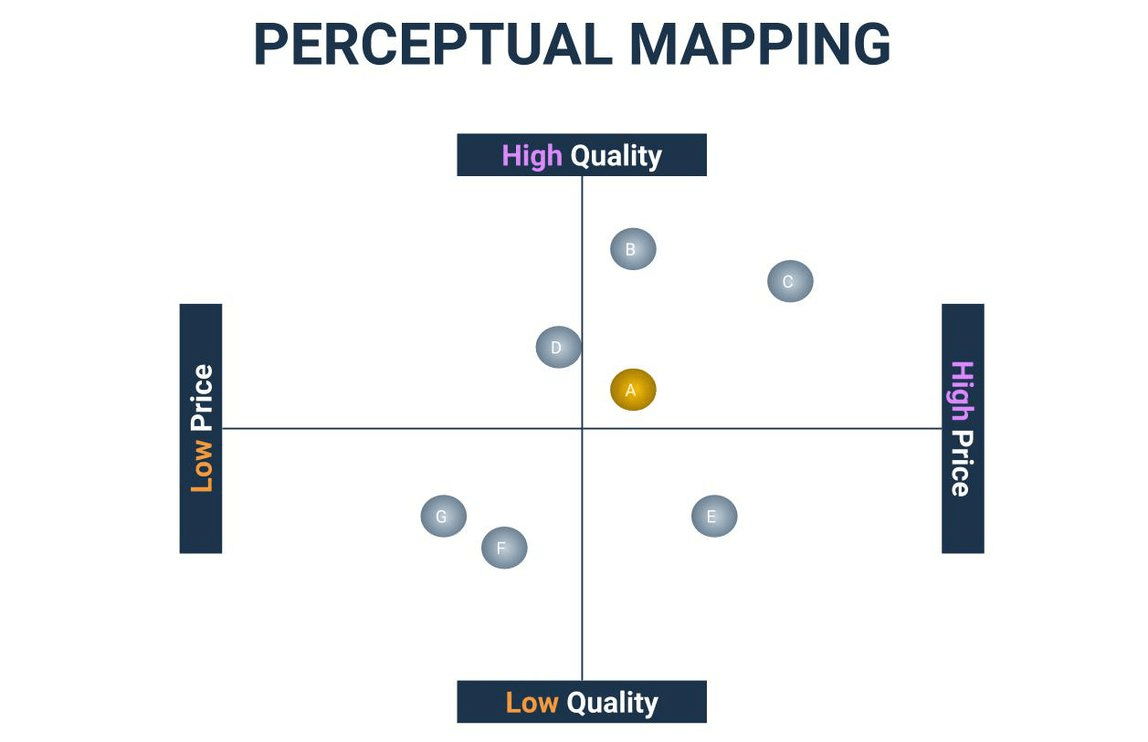
This competitive analysis framework generally consists of two key attributes (e.g., price and quality, as seen in the example below). Once you’ve chosen the attributes you want to focus on, the next step is plotting the brands, products, or services to see how they’re positioned among them.
 Perceptual mapping utilizes customer input to understand your brand, product, or service from the customer’s perspective. However, you can also use specific marketing data to look at the competitive landscape from a digital customer engagement perspective. This objectively looks at how customers engage with you and your competitors online.
[novashare_tweet tweet= “Perceptual mapping utilizes customer input to understand your brand, product, or service from the customer’s perspective.” theme= “simple-alt” cta_text= “Click to tweet” hide_hashtags= “true”]
Ways to Use Perceptual Mapping
Perceptual mapping can be used with both qualitative data and quantitative data. While creating the perceptual map remains the same for both, they serve different purposes. These perceptual mapping techniques show us how to gain insight into customer perceptions and digital customer engagement:
Mapping Customer Perceptions (Qualitative Data)
A perceptual map focused on qualitative data can help us identify customers’ subjective feelings and opinions toward a brand, product, or service. The attributes you choose to map can only be determined through direct customer communication. This can include interviews, surveys, polls, reviews, etc.
The first step in this perceptual mapping technique is to determine two attributes you want your perceptual map to focus on. The easiest way to find these attributes is to put yourself in the customer’s shoes: What are two essential factors specific to your company that customers use to determine whether they want to make a purchase?
You can find out what attributes you want to focus on in various ways. Still, it generally comes down to two main methods: a company’s collective knowledge and experience of the market or a verified market research study.
Using WordPress as an example, let’s say the two attributes we’ve chosen to map are features and user-friendliness, two things customers looking for a website builder would want.
Next, we’ll identify competitors. Let’s use Squarespace, Weebly, and Wix—popular brands that also occupy the website builder space. Our goal is to determine how customers perceive WordPress’s features and user-friendliness in comparison to these brands.
For this example, let’s pretend we’ve compiled data from a perceptual mapping questionnaire showing how customers feel about the features and user-friendliness of these website builders on a scale of 1 to 10. Using this data, we can plot all the brands on a map to see how they’re positioned next to each other in the context of these attributes.
This gives us a visual representation of how customers view WordPress among its competitors in terms of features and user-friendliness.
Do people see WordPress as having better features but Wix as more user-friendly? With insight into this, WordPress can decide whether to address the user-friendliness factor or continue to focus on offering its customers a wide range of features.
Mapping Digital Customer Engagement (Quantitative Data)
A perceptual map focused on quantitative data can help us identify objective, measurable statistics about a brand, product, or service. The attributes you map for this approach need to be based on empirical evidence. That can mean a company’s location, the number of stores, employees, etc.
This perceptual mapping technique uses marketing data to determine digital customer engagement. Using WordPress.com as an example, we’ll start by deciding which two attributes we want to use for our perceptual map. For this example, we’ll use total engagement on social media and time on site. We’ll also use Squarespace.com, Weebly.com, and Wix.com as competitors.
We’ll start by pulling total engagement on social media data and time-on-site data over the last year:
Total Engagement on Social Media Data
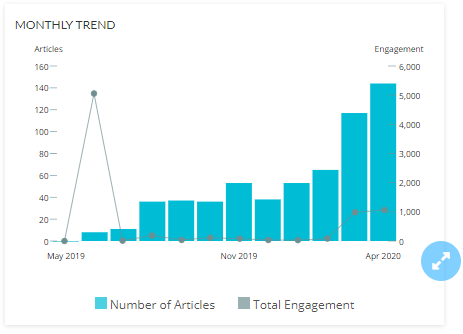
Log into Alexa’s Content Exploration tool and input each site to find its total social media engagement. This example shows WordPress.com’s total engagement over the last year at 7,700. Repeat this process for each site.

You can also see the monthly engagement trend for each site individually to see if there were any spikes worth investigating.
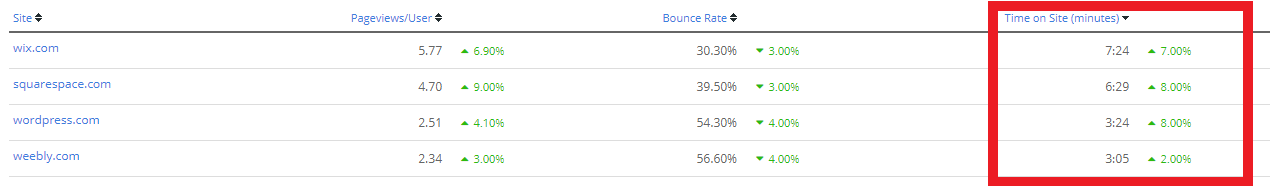
Time-on-Site Data
Log into Alexa’s Site Comparisons tool, and you can put up to 10 sites you want to compare to see their time on site. You can sort these times to see which sites have the most time on site and which have the least.
Now that we’ve gathered the necessary data about total social media engagement and time on site, we can create a Microsoft Excel spreadsheet to input these findings and create a perceptual map.
We’ve kept it simple for our example, but you can customize your perceptual map to your liking with company logos, colors, and more:
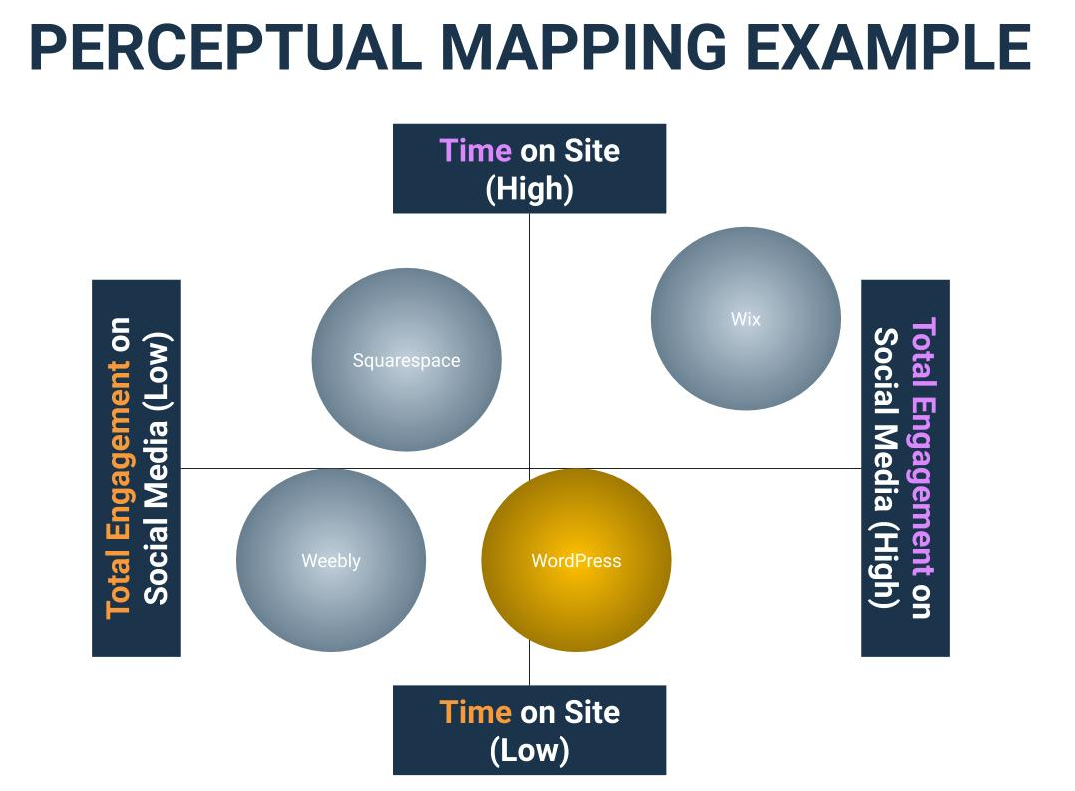
Now that we have a concrete visual representation, we can see how WordPress.com is doing in these two attributes compared to its competition.
We can see that Wix.com has the highest total social media engagement and the highest time on-site among its competitors. Weebly.com has the lowest total social media engagement and the lowest time on-site.
The next step is to analyze these findings to determine why.
Is Weebly.com’s time on site so low because people are leaving it quickly or because they know exactly what they want to do while on-site?
Is Wix.com’s time on site so high because people are taking longer to search through it?
We must analyze all the data to determine why WordPress.com is positioned next to its competition.
Perceptual Mapping Tools You Can Use
Marketing teams with small budgets can still create great perceptual mapping PDFs and other marketing diagrams. These tools are a great starting point:
Creately
Creately is a SaaS visual collaboration tool with diagramming and design capabilities designed by Cinergix. Creately has two versions: an online cloud edition and a downloadable offline edition for the desktop, which is compatible with Windows, Mac, and Linux.
- The free basic plan includes five public documents, one folder, and three collaborators.
- The team plan is $12/month and includes unlimited private documents, folders, collaborators, high-resolution exports, and four types of imports and exports.
GroupMap
(Free 14-day trial)
The professional plan is $60/month and includes one map creator, 50 free participants per map, advanced process design, facilitator controls, and reporting.
Visual Paradigm
(Free 30-day trial)
The professional plan is $35/month and includes mind-mapping, data visualization tools, an infographic maker, and more.
Map Out Your Marketing Strategy with Alexa
The ultimate goal of effective perceptual mapping is to strengthen your marketing strategy. Alexa gives you all the marketing tools you need to stay ahead of the competition.
Source: blog.alexa.com